Observability for AI Agent Pipelines in Production
Multi-step AI agents fail in ways infrastructure metrics can't explain. This guide covers how to instrument chained model and tool calls with distributed tracing and structured logging so engineering teams can actually debug production failures and latency.
What is observability for AI agent pipelines?
Observability for AI agent pipelines is the practice of instrumenting every step of a multi-step agent workflow — model calls, tool invocations, retries, and handoffs between agents — so engineering teams can see what happened, why it happened, and how long each step took. Unlike traditional application observability, it has to account for non-deterministic outputs, variable-length reasoning chains, and calls that fan out across multiple models and external tools.
Most teams building their first production agent get this backwards. They monitor the infrastructure (CPU, memory, request counts) and ignore the reasoning layer — the sequence of prompts, tool calls, and intermediate outputs that actually determines whether an agent succeeded or quietly failed. When an agent gives a wrong answer or times out, infrastructure metrics rarely tell you why.
Why do multi-step agent workflows need distributed tracing?
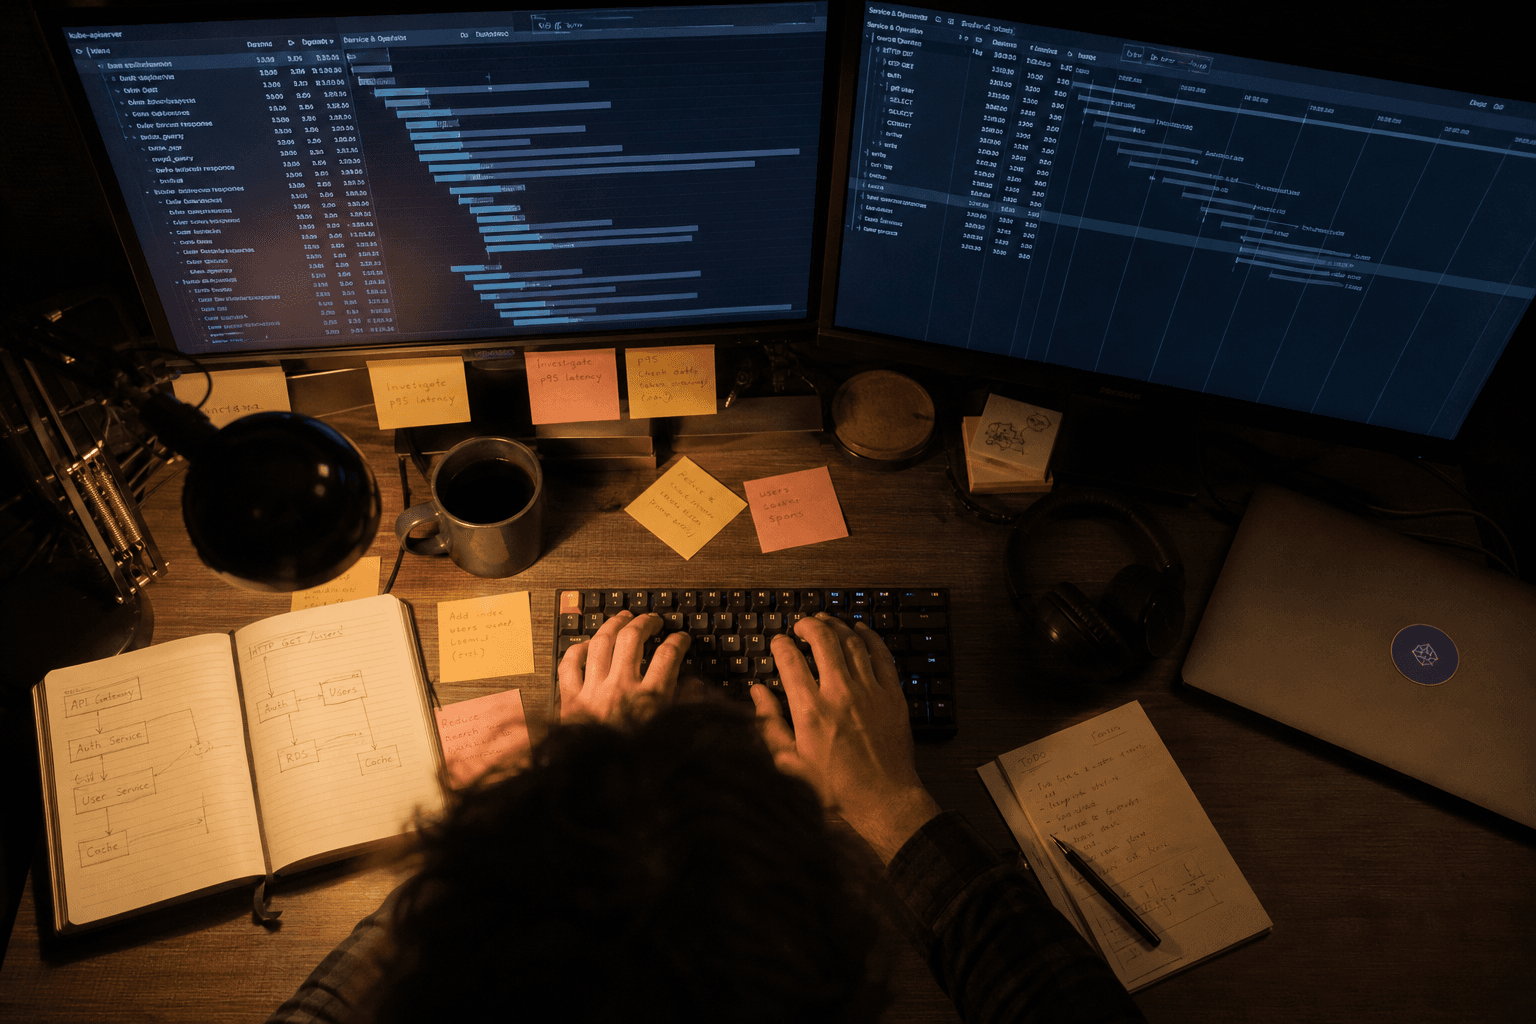
Distributed tracing matters for agent pipelines because a single user request can trigger a chain of five, ten, or more dependent calls — a planning step, several tool invocations, a retrieval step, and a final synthesis call — each of which can fail or run slowly independently. Without a way to see the whole chain as one connected trace, debugging becomes guesswork.

A trace is a record of a single request's full execution path, broken into spans that each represent one unit of work (a model call, a database lookup, an API call to an external tool). A span is the smallest traceable unit, carrying a start time, duration, inputs, outputs, and any errors. When spans are correctly linked by a shared trace ID, an engineer can open one trace and see exactly where time was spent and where a workflow diverged from expected behaviour — instead of correlating timestamps across five separate log files.
This matters more, not less, as agent pipelines grow. A chained workflow with conditional branching, retries, and parallel tool calls behaves less like a simple API request and more like a distributed system — which is exactly the problem distributed tracing was built to solve in traditional microservices, just applied to a reasoning chain instead of a service mesh.
What should you instrument in an agent pipeline?
At minimum, instrument every model call (prompt, response, token usage, latency, model version), every tool or function invocation (inputs, outputs, success/failure, latency), and every decision point where the agent chooses a next step. Each of these should be captured as a span with a parent-child relationship back to the originating user request.
Beyond the individual spans, it's worth capturing session-level context — which conversation or task the trace belongs to, and any state carried between turns. This is where managed platforms are starting to build in primitives: Google's Vertex AI, for example, provides session and session-event resources for stateful agent execution (via its Reasoning Engines query, streamQuery, and asyncQuery interfaces), which gives you a structural foundation for associating a sequence of agent actions with a single logical session. It's worth being clear-eyed about what this does and doesn't give you: session tracking is not the same as span-level tracing, and most platforms — Vertex AI included — don't yet describe out-of-the-box trace propagation across chained agent or tool calls. Vertex AI's Tensorboard and model-deployment-monitoring jobs are useful for experiment and model-level metrics, but they're oriented at model performance rather than pipeline-level debugging. If you need to see inside a multi-step agent execution, you will generally need to add that instrumentation yourself, regardless of which platform you build on.
Structured logging vs distributed tracing: what's the difference?
Structured logging is the practice of emitting log records as consistent, machine-parseable key-value data (rather than free-text strings), so logs can be filtered, aggregated, and correlated at scale. Distributed tracing is the practice of linking related spans of work across a request's full execution path so the relationships between steps — not just the individual events — are visible.
They solve different problems and both are necessary. Structured logs tell you what happened inside a single step in detail (the exact prompt sent, the exact tool response received). Traces tell you how the steps relate to each other and where time and failures accumulated across the whole chain. An agent pipeline without structured logs has traces with no detail; a pipeline without tracing has detailed logs with no way to reconstruct the story.
| Capability | Structured logging | Distributed tracing | Metrics/monitoring |
|---|---|---|---|
| Primary question answered | What exactly happened at this step? | How did this request flow across steps? | How is the system performing in aggregate? |
| Granularity | Per event | Per request, across spans | Aggregated over time |
| Best for | Debugging a specific prompt or tool call | Diagnosing latency and failure across a chain | Spotting trends and regressions |
| Typical gap in early agent builds | Logs exist but aren't linked to a request | Rarely implemented until something breaks | Infrastructure-only; ignores reasoning layer |
How do you debug latency and failures across chained model and tool calls?
Start by making trace propagation non-negotiable: every call in the pipeline — model or tool — must carry the parent trace ID forward, including across asynchronous calls and retries. Without this, you'll have isolated logs that can't be reassembled into a coherent timeline when something goes wrong in production.
Once propagation is in place, latency debugging becomes a matter of looking at span durations rather than guessing. Most production agent latency sits in one of three places: slow model inference on long-context calls, serial tool calls that could be parallelised, or retry loops triggered by malformed outputs. A properly traced pipeline makes all three visible immediately, rather than requiring you to reproduce the failure locally.
For failures specifically, capture the full input and output of each span, including partial or malformed model outputs — these are often the root cause of downstream tool-call failures, and they're invisible if you only log the final response the user saw.
What tools support AI agent observability today?
A growing set of dedicated tools — including LangSmith, Langfuse, Arize, and OpenTelemetry-based instrumentation for LLM applications — are purpose-built for tracing agent and LLM pipelines, typically offering span-level views of prompts, tool calls, token usage, and latency out of the box. General-purpose cloud platforms are earlier in this journey: as noted above, Vertex AI currently offers session tracking and model-level monitoring rather than agent-pipeline tracing as a first-class feature.
The right choice depends on your existing stack, your compliance requirements (particularly relevant for regulated Australian sectors like fintech and healthtech), and whether you need self-hosted versus managed tooling. There's no single correct answer here — what matters is that observability is designed in from the start of the build, not retrofitted after a production incident.
Where does this fit into a broader AI engineering practice?
Observability isn't a bolt-on feature — it's part of what separates a prototype agent from one that can run reliably in production. Teams moving from a proof of concept to a production agent pipeline need to think about tracing, structured logging, and monitoring at the same time they think about architecture and tool design, not after launch. This is core to the ai-engineering work we do with clients, and it often surfaces gaps in the underlying data and logging infrastructure that need addressing through data-infrastructure work before an agent pipeline can be trusted with real production traffic.
If your organisation is earlier in the journey — evaluating whether and where agents make sense at all — that's a conversation worth having before instrumentation, as part of ai-product-strategy. You can find more on related production AI topics in our insights.
Getting started with agent observability
If you're running — or about to run — multi-step AI agents in production and don't yet have a clear view into what's happening inside the chain, start small: pick one workflow, instrument every span with trace propagation and structured logs, and build outward from there. If you're exploring how to make your AI agent pipelines production-ready, we can help — get in touch and we'll walk through what instrumentation makes sense for your stack.
Chris Kerr
Partner at Horizon Labs, an AI product consultancy and venture studio. A commercially focused product and technology leader with 20+ years building and scaling digital platforms, teams, and businesses across SaaS, travel, eCommerce, logistics and transport, and digital marketing — operating at the intersection of product, engineering, and data. Writes about platform strategy, AI transformation, modern data ecosystems, and the operational discipline that separates AI demos from AI products.